

For many growers the 2023-24 season is slowly ending with defoliation and picking well underway. As no two seasons are the same, and a post-harvest review allows the opportunity to reflect on the faming system over the past season, review what worked well, what maybe not so much, and a general look back at the seasonal climatic influence upon crop management, yield, and quality.
CSD offer several digital tools to assist with reviewing climatic indices across seasons which can assist with insights on climatic influence.
For a combination of numerical metrics and ready to go graphs (handy for crop summary reports), comparing this season to the previous – the Weather Summary tool is the go-to. This tool delves into the Bureau of Meteorology SILO dataset and returns an array of climate metrics for the selected timeframe and micronaire period, all achieved by simply selecting your nearest BOM SILO station, seed imbibition date, first defoliation date and the date range from the start and end of the micronaire period.
The tool returns tables of information (Figures 1 & 2) and graphs including min and max temps, planting temperature, min and max temps throughout the micronaire period, rainfall, solar radiation and crop evapotranspiration.
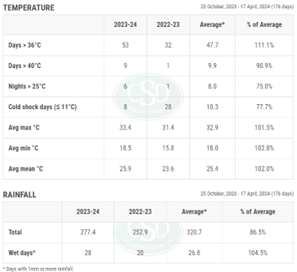
Figure 1: Temperature & Rainfall
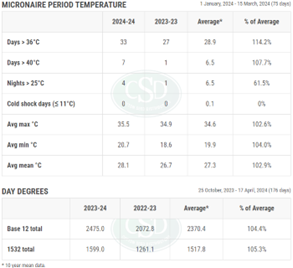
Figure 2: Micronaire Period & Day Degrees
Access the weather summary tool at https://tools.csd.net.au/weather-summary
For access to data across 5 seasons accessing the Day Degree Calculator (DDC) seasonal comparison is the way to go. This tool allows the comparative review across 5 seasons and includes a 10-year mean for each metric. A handy feature of the DDC is the ‘Download’ option allowing the export of a excel spreadsheet. This download contains a multitude of data including daily minimum and maximum temperatures, calculated daily and cumulative day degrees (B12 and 1532) and other key metrics. Furthermore, there is workbook containing a 10-year comparison of the data allowing users to deep dive into the numbers.
Access the Day Degree Calculator at https://tools.csd.net.au/ddc
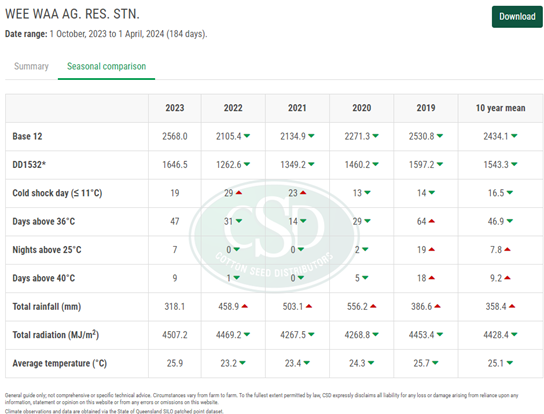
Figure 3: DDC 5-year seasonal comparison
Finally, CottonTracka makes accessing climate data simple and couldn’t be any easier. Simply select ‘download’ from the menu and download a pdf of a season summary for this season’s climate metrics or alternatively, download a pdf featuring a historical summary containing 10 years of data.
Access CottonTracka at https://tools.csd.net.au/cottontracka
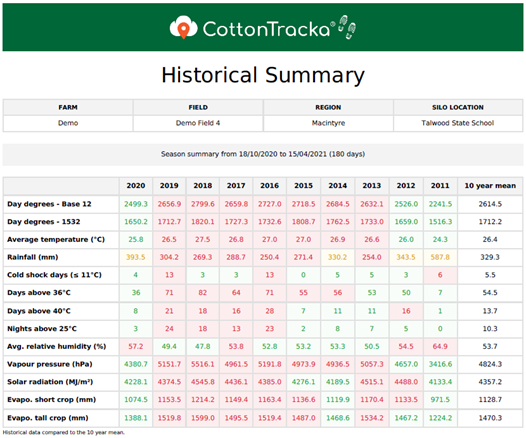
Figure 4: CottonTracka 10-year Historical Summary